GKE, Istio and Managed Service Mesh

This is the sixth post in a series exploring the features of GKE Enterprise, formerly known as Anthos. GKE Enterprise is an additional subscription service for GKE that adds configuration and policy management, service mesh and other features to support running Kubernetes workloads in Google Cloud, on other clouds and even on-premises. If you missed the first post, you might want to start there.
In the first part of this series, we’ve focused on the new concepts that GKE Enterprise introduces for managing your clusters such as fleets and configuring features and policies. We’ll now pivot to look more closely at the advanced features that GKE Enterprise provides for managing our workloads. Since the early days of Kubernetes, workloads have typically been deployed following a microservices architecture pattern, deconstructing monoliths into individual services, and then managing and scaling these components separately. This provided benefits of scale and flexibility, but soon enough issues developed around service discovery, security and observability. The concept of a Service Mesh was introduced to address all of these concerns.
But what is a Service Mesh? How do you use one and do you even need one? Once people have mastered the complexity of Kubernetes, introducing a Service Mesh seems like yet another complicated challenge to master. There are arguments on both sides for the necessity of a Service Mesh and the benefits it provides versus the resources it consumes and the complexity that it either solves or introduces. By the end of this post, hopefully you’ll have a good understanding of these issues and know when and where using a Service Mesh is right for you.
So here’s what we’re going to cover today:
Understanding the concept and design of a Service Mesh
How to enable Service Mesh components in your GKE cluster and fleet
Creating Ingress and Egress gateways with Service Mesh
Using Service Mesh to provide network resilience
We’ll focus on the fundamentals of Service Mesh in this post, and then build on that knowledge in the next two posts as we leverage Service Mesh for multi-cluster networking and security.
What is a Service Mesh?
To fully explain the concept of a Service Mesh, it helps to consider the interconnected parts of a Kubernetes cluster from the point of view of the control plane and the data plane.
A typical cluster may be running many different containers and services at any time, and these workloads, along with the nodes that are hosting them, can be considered the data plane.
The control plane on the other hand is the brain of the cluster. It comprises the scheduler and controllers that make decisions about what to run and where. Essentially, the control plane tells the data plane what to do.
But the control plane in Kubernetes has limitations. For example, most common patterns for network ingress only provide flexibility at the ingress layer, without leaving much control over traffic or observability inside the cluster. A Service Mesh is an attempt to extend these capabilities by providing an additional control plane, specifically for service networking logic. This new Service Mesh control plane works alongside the traditional control plane, but it can now provide advanced logic to control how workloads operate and how their services connect to each other and the outside world.
Some of the most useful features of a Service Mesh are:
Controlling inter-service routing
Setting up failure recovery and circuit breaking patterns
Microservice-level traffic observability
Mutual end-to-end service encryption and service identity
Once you’ve learned how to implement these new features, you should have a better idea of where they can be useful and if you want to use them or not for your own workloads.
Istio and the Sidecar pattern
The Service Mesh in GKE Enterprise is powered by Istio, one of the most popular open-source Service Mesh projects. Istio provides advanced traffic management, observability and security benefits, and can be applied to a Kubernetes cluster without requiring any manual changes to existing deployments. For more information about Istio, see the website at https://istio.io/
Istio deploys controllers into the control plane of your clusters, and gains access to the data plane using a sidecar pattern. This involves deploying an Envoy proxy container that is run as a sidecar container into each workload Pod. This proxy takes over all network communication for that Pod, providing an extension of the data plane. The proxy is then configured by the new Istio control plane. Hence the terminology of a mesh: Istio is overlaying the services in your cluster with its own web of proxies. Here’s a basic illustration of this concept:
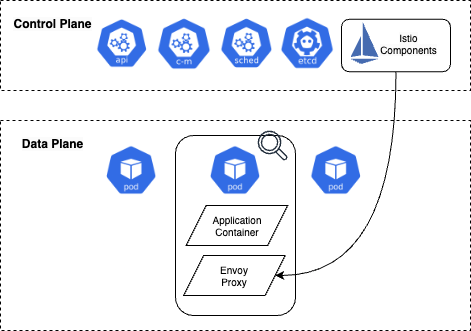
Deploying Service Mesh components
Service Mesh can be installed in a few different ways when using GKE Enterprise. The recommended approach is to enable the managed Service Mesh service, which provides a fully managed control plane for Istio. You can enable Service Mesh from the Feature Manager page in the GKE Enterprise section of the Google Cloud console, as shown below. Once Service Mesh is enabled for your fleet, new clusters registered to it will automatically have Service Mesh installed and managed. You can optionally sync your fleet settings to any existing clusters; however, you will need to enable Workload Identity on these clusters first if you haven’t already.
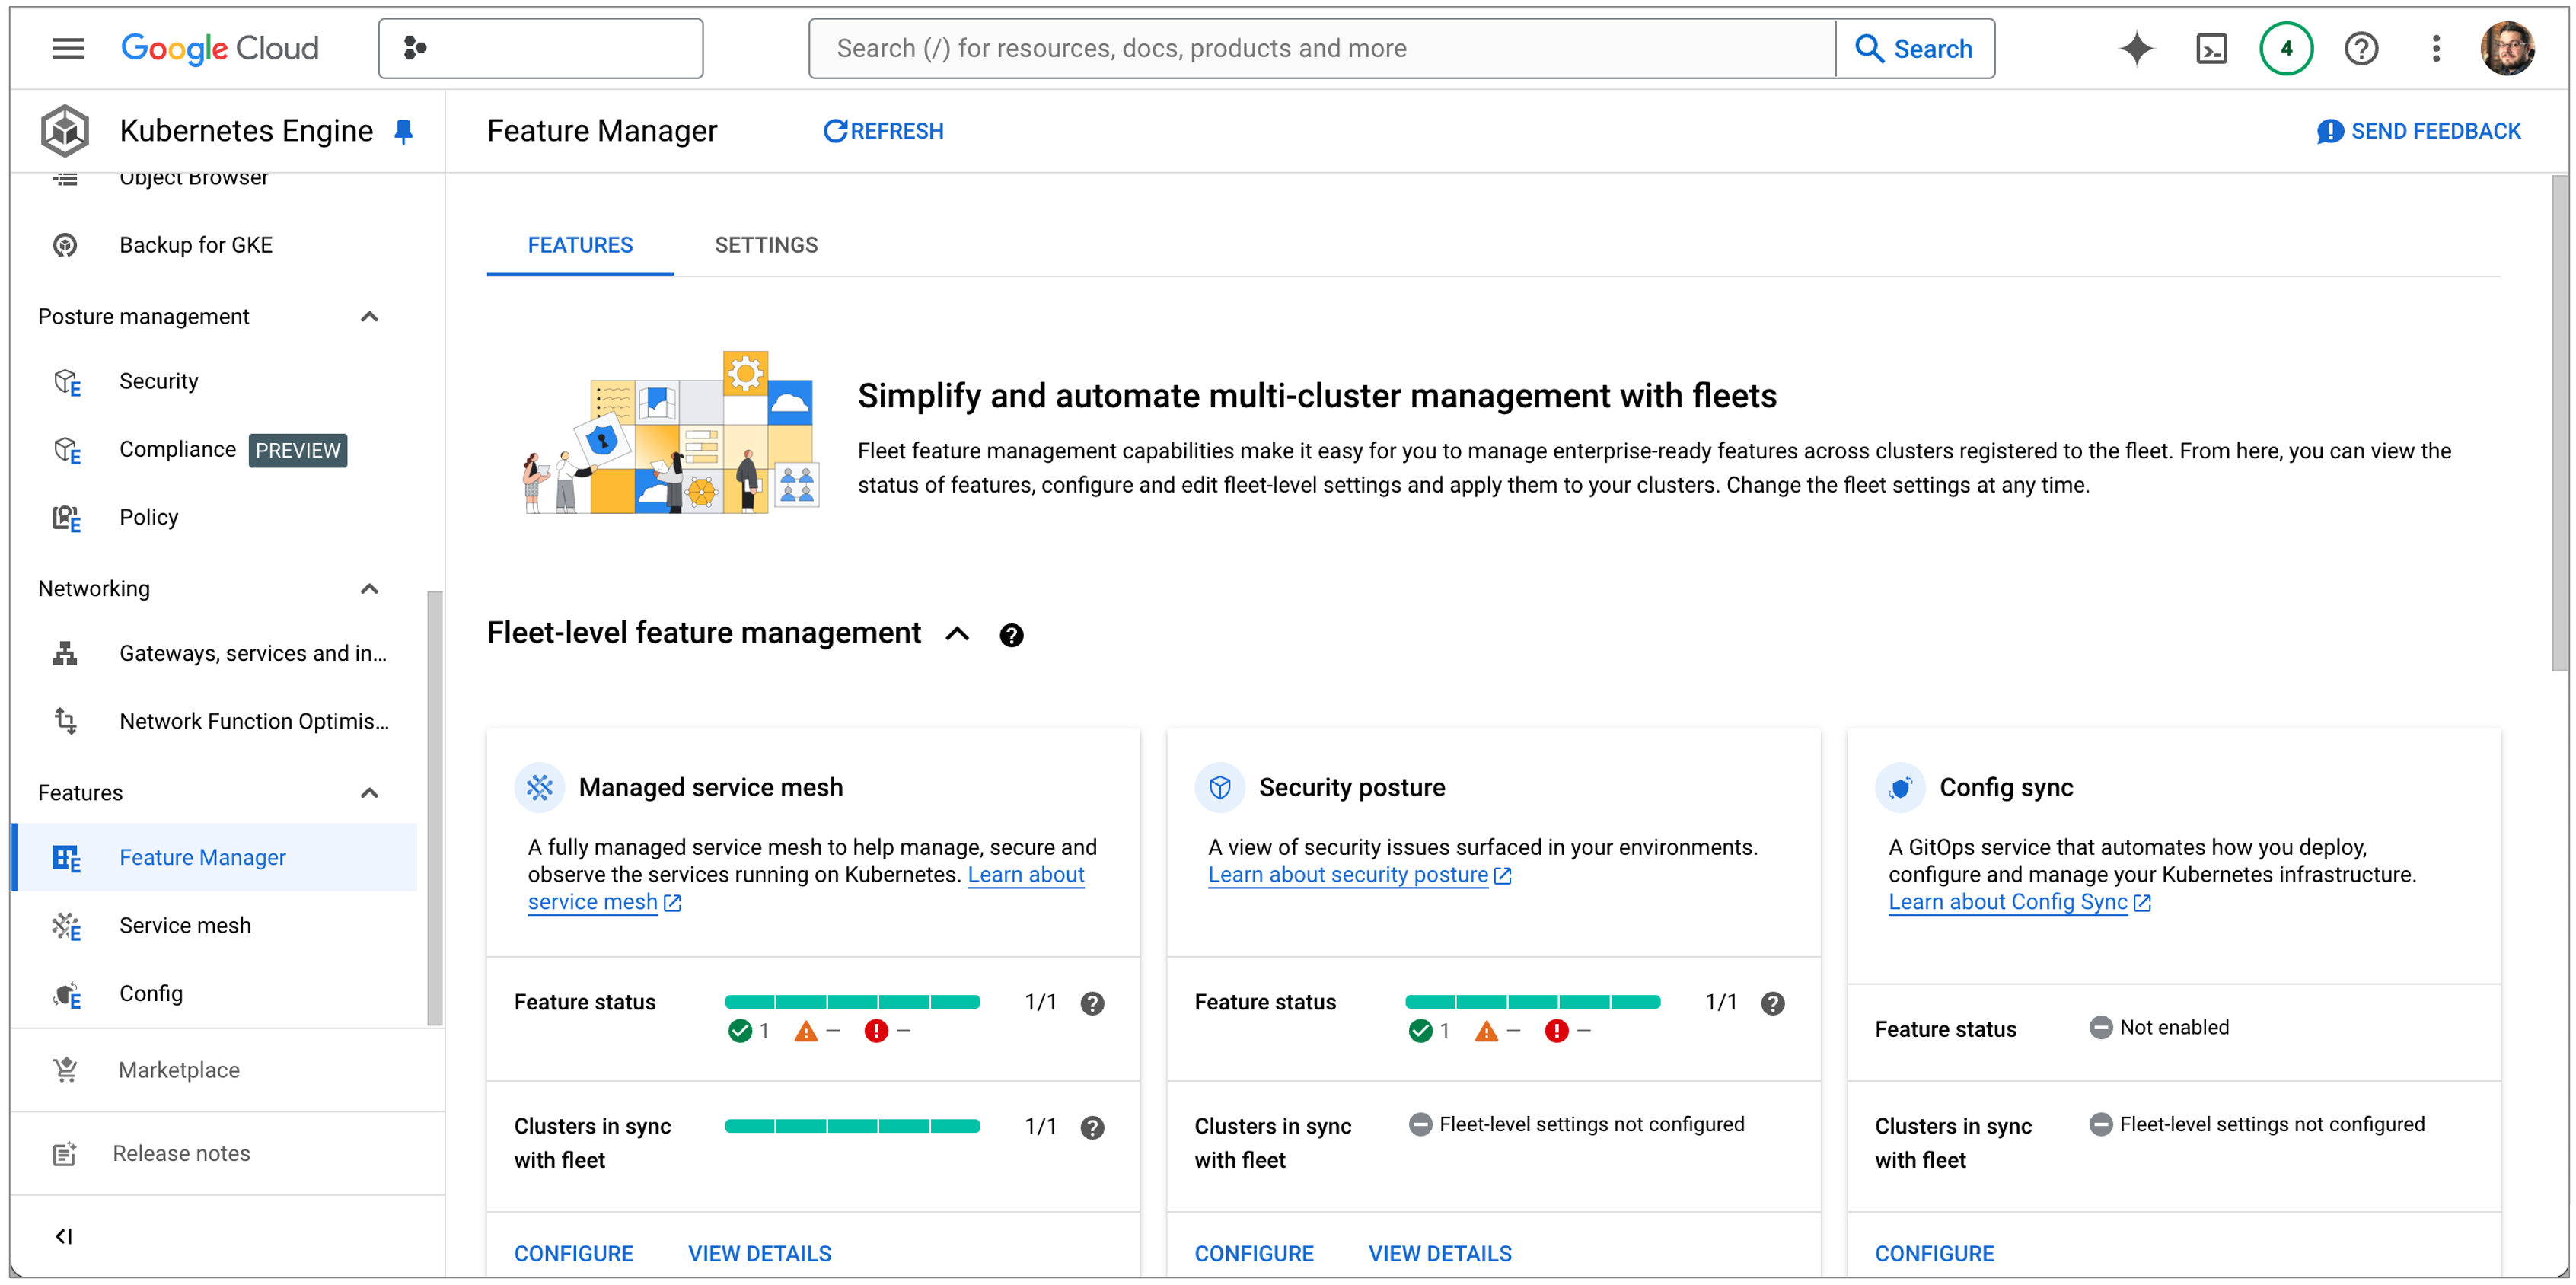
Using the managed option for Service Mesh reduces the load on your clusters because most of the control plane work is offloaded to the managed service. Enrolled clusters will still need to run the mdp-controller deployment, which requires 50 millicores of CPU and 128Mi of RAM, and the istio-cni-node daemonset on each node, which requires 100 millicores of CPU and 100Mi of RAM per node.
If you have a specific use case outside of the managed service, you can use Google’s asmcli tool to install the Istio Service Mesh directly to your clusters and bypass the managed service. You may choose to do this for example if you need a specific Istio release channel that isn’t aligned to your GKE release channel, or if you need to integrate a private certificate authority. Generally, the managed service is recommended to reduce the complexity involved.
Enabling sidecar injection
At this stage we’ve just set up the control plane for our Service Mesh, and the next thing to do is to set up the data plane. As we mentioned earlier, the data plane comprises an Envoy proxy sidecar container running inside our application Pods. This proxy takes over all network communication for our applications and communicates with the Service Mesh control plane.
Conveniently, we can enable the automatic injection of sidecars into our workloads. This is done at the namespace level and can be achieved simply by adding a metadata label to a namespace. For example, if we have a namespace called frontend, we can label it for sidecar injection with this command:
kubectl label namespace frontend istio-injection=enabled
Any new Pod now created in this namespace will also run the Envoy proxy sidecar. This won’t affect existing Pods unless they are terminated, and then potentially recreated by their controller object (such as a Deployment). A quick way to tell if sidecar injection has worked is to simply look at the output from kubectl get pods and note that you should have one more ready container than you used to (for example, 2/2 containers ready in a Pod).
Alternatively, you can manually inject the sidecar container by modifying the object configuration, such as a Deployment YAML file; the istioctl command line tool can do this for you. For more information see https://istio.io/latest/docs/setup/additional-setup/sidecar-injection/#manual-sidecar-injection
Ingress and Egress gateways
The next stage in setting up our Service Mesh is to consider gateways, which manage inbound and outbound traffic. We can optionally configure both Ingress gateways to manage incoming traffic, and Egress gateways to control outbound traffic. Ingress and Egress gateways comprise standalone Envoy proxies that are deployed at the edge of the mesh, rather than attached to workloads.
The benefit of using Service Mesh gateways is that they give us much more control than using low level objects like Service or even the Kubernetes Ingress object. These previous attempts have bundled all configuration logic into a single API object, whereas our Service Mesh lets us separate configuration into a load balancing object – the Gateway – and an application-level object – the VirtualService.
In the OSI network model, load balancing takes place at layers 4-6 and involves things like port configurations and transport layer security. Traffic routing is a layer 7 issue and can now be handled separately by the Service Mesh.
We’ll talk more about VirtualServices later in this post, but for now let’s just set up an Ingress Gateway. The minimum requirement for this will be a deployment of the istio-proxy container, a matching service and the necessary service accounts and RBAC role assignments. For scalability it’s also a good idea to attach a Horizontal Pod Autoscaler to the deployment. Thankfully, Google have done the hard work for us and provided a git repo here: https://github.com/GoogleCloudPlatform/anthos-service-mesh-packages.git that contains all the necessary object definitions.
Before we go ahead and apply those manifests though, we quickly need to think about namespaces again. A gateway should be considered a user workload, so it should run inside a namespace to which your users, or developers, have access. Depending on the way your teams are set up in your organization you may wish to have a central dedicated namespace just for the Ingress Gateway, for example gateway-ns, or you may wish to create gateways in the same namespace as the workloads they serve. Either pattern is acceptable, you just need to choose the one that works for the way you manage user access to your clusters.
For now, let’s go ahead and create a dedicated namespace for the gateway:
kubectl create ns gateway-ns
Just like we demonstrated earlier, we need to apply a metadata label to this namespace that will enable Istio’s auto-injection:
kubectl label namespace gateway-ns istio-injection=enabled
Now we can go ahead and apply the manifests from the git repo to create the Ingress Gateway. Inside the git repo in your local filesystem, change into the samples/gateways directory, and then apply the manifests to our chosen namespace with this command:
kubectl apply –n gateway-ns –f istio-ingressgateway
This will apply all of the objects in that directory, including the deployment, the autoscaler, RBAC configuration and even a Pod disruption budget. At this stage this might feel eerily familiar to just deploying a plain old Ingress controller, but we have a few more moving pieces to deploy before it will start to make sense.
Deploying sample microservices
Continuing to use Google Cloud’s demo repo, let’s go ahead and deploy the Online Boutique application stack. This is a neat microservices demonstration that will deploy multiple workloads and give us great visualisations in the Service Mesh dashboard later.
From the samples/online-boutique/kubernetes-manifests directory of the git repo in your local filesystem, create all the required namespaces with this command:
kubectl apply –f namespaces
We’ll also need to enable sidecar injection on each namespace. We can do this with a handy bash for loop:
for ns in ad cart checkout currency email frontend loadgenerator payment product-catalog recommendation shipping; do
  kubectl label namespace $ns istio-injection=enabled
done;
Then we’ll create the service accounts and deployments:
kubectl apply –f deployments
And finally, the services:
kubectl apply –f services
You should now be able to see that all Pods in the namespaces we’ve created have 2 containers running in them, because the Envoy proxy has been successfully injected. But so far, these are still all the regular Kubernetes objects that we already know about. When do we get to the Istio CRDs?
Service Entries
The demo Online Boutique application makes use of a few external services, such as Google APIs and the Metadata server. When your workloads need to access external network connections, they can of course do this directly. Making a network request to a service that is unknown to the mesh will simply pass through the proxy layer. But what if you could treat external connections as just another hop in your mesh, and benefit from the observability this could give you? That’s the job of the ServiceEntry object, which allows you to define external connections and treat them as services registered to your mesh.
Back in our git repo, move to the samples/online-boutique/istio-manifests directory and take a look at the allow-egress-googleapis.yaml file. In this manifest, service entries are created for allow-egress-googleapis and allow-egress-google-metadata, and both entries specify the hosts and ports required for the connections.
ServiceEntry objects can also be used to add sets of virtual machines to the Istio service registry and can be combined with other Istio objects (which we’ll learn about soon) to control TLS connections, retries, timeouts and more.
We’ll apply this manifest to our cluster, followed by the frontend-gateway.yaml file in the same directory. This will create two more Istio CRD objects, a Gateway and a VirtualService.
Now at this stage we’ve deployed all kinds of workloads and objects, so we need to slow down and take a step back to explain how they all work together. Here’s a rough diagram of the request from a user getting all the way to Pods that serve the frontend workload – this is basically the website element of the Online Boutique demo stack:
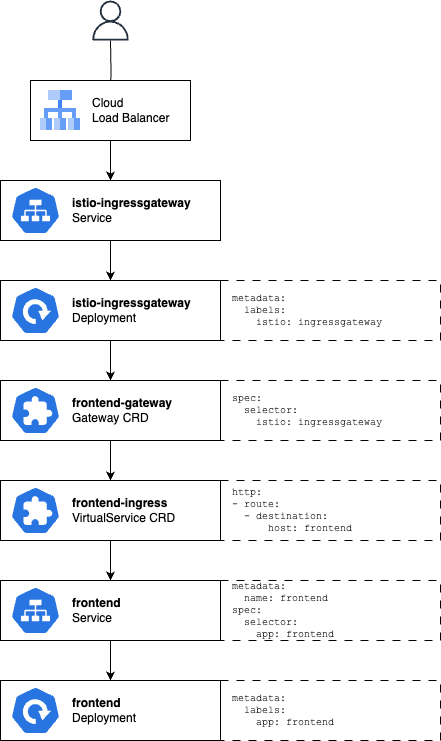
Firstly, our Google Cloud Load Balancer provides our actual endpoint on the Internet with an anycast IP address. Requests received by the load balancer are routed through the istio-ingressgateway Service object to Pods in the istio-ingressgateway Deployment. Recall that this is the Ingress Gateway we deployed right at the start.
At the bottom of the diagram is our actual frontend Deployment, comprising Pods that will receive traffic from the frontend Service. So far, these are standard Kubernetes objects. So, let’s explore the new CRDs in between.
Gateway
Although we already created the istio-ingressgateway Deployment that actually provides the Ingress Gateway, we haven’t yet configured it. The Gateway CRD object describes the gateway, including a set of ports to expose over which protocols and any other necessary configuration. In the definition used by our example, we specify that port 80 should be exposed for HTTP traffic, and that we accept traffic for all hosts (denoted by the asterisk in this section of the manifest). The istio: ingressgateway selector in the Gateway CRD object tells Istio to apply this configuration to the Pods in our istio-ingressgateway Deployment, because if you take a look at that manifest, you’ll see a matching label in its metadata.
For more detail about what can be accomplished with the Gateway object see https://istio.io/latest/docs/reference/config/networking/gateway
Virtual Services
The VirtualService object configures the routing of traffic once it has arrived through our Gateway. In our example manifest we specify a single HTTP route so it will capture all traffic, and we specify that the “backend” for this traffic is a host called frontend. Hosts simply represent where traffic should be sent, and could be IP addresses, DNS names or Kubernetes service names. In this case, we can get away with using a short-name like frontend because the Service its referring to exists in the same namespace as the VirtualService.
The VirtualService object also references the frontend-gateway Gateway object we created earlier. This is a pattern of Istio, where by referencing the Gateway like this, we apply our VirtualService configurations to it. This is similar to how our Gateway object applied configurations to our ingress gateway Pods.
The VirtualService CRD allows for some very flexible configuration. Although this example routes all traffic to a single backend, we could choose to route traffic to different hosts based on different routing rules which would be evaluated in sequential order. For example, routing rules can specify criteria such as HTTP headers, URL paths, specific ports or source labels. We can match routing rules based on exact strings, prefixes or regular expressions. And we can even specify policies for HTTP mirroring and fault injection.
For more detail about the VirtualService CRD, see https://istio.io/latest/docs/reference/config/networking/virtual-service/
Service Mesh dashboards
With the Online Boutique sample stack running, we can access the external endpoint provided by the load balancer and browse around a few pages. Just use kubectl to get the service in the gateway-ns namespace and copy its external IP.
Back in the Kubernetes section of the Google Cloud console, we can choose Service Mesh from the sub-menu, and see a list of services that our mesh knows about, as shown in the screenshot below.
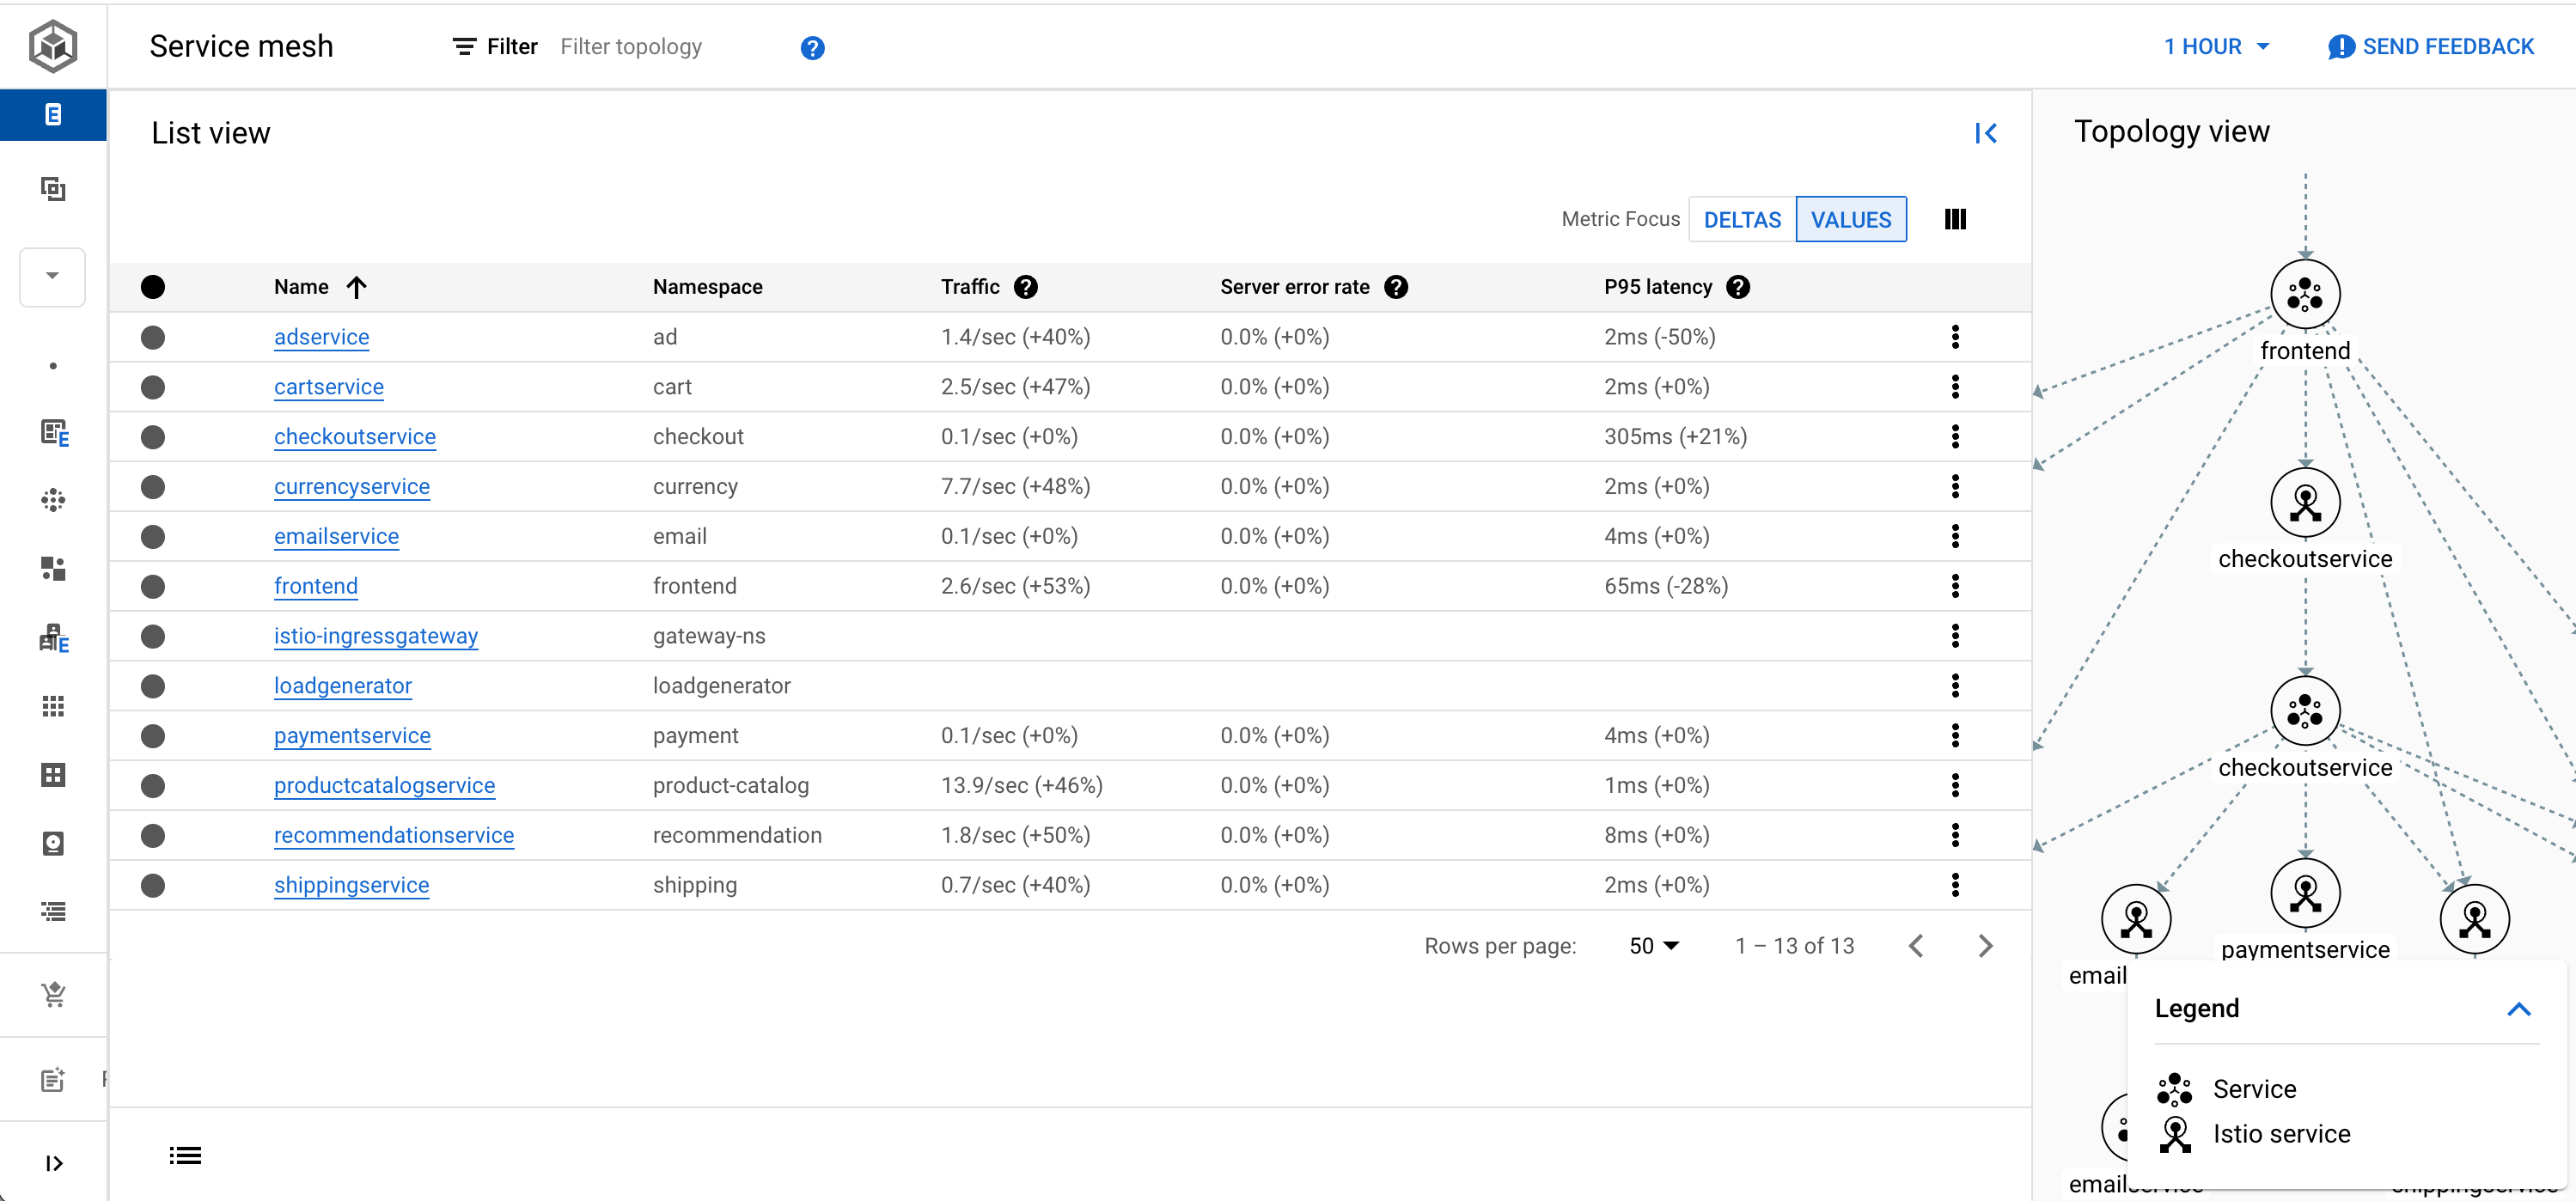
Straight away you should be able to see some of the benefits of using Istio! Because the Envoy proxies capture all network information, from the moment a request enters the ingress gateway and even while traffic traverses between microservices, we suddenly have a much higher level of observability than we would when using traditional Kubernetes objects. We can view the traffic rate for each microservice, along with its error rate and latency. Selecting individual services will also allow us to create Service Level Objectives (SLOs) and alerts for when they are not met. This is a powerful level of observability!
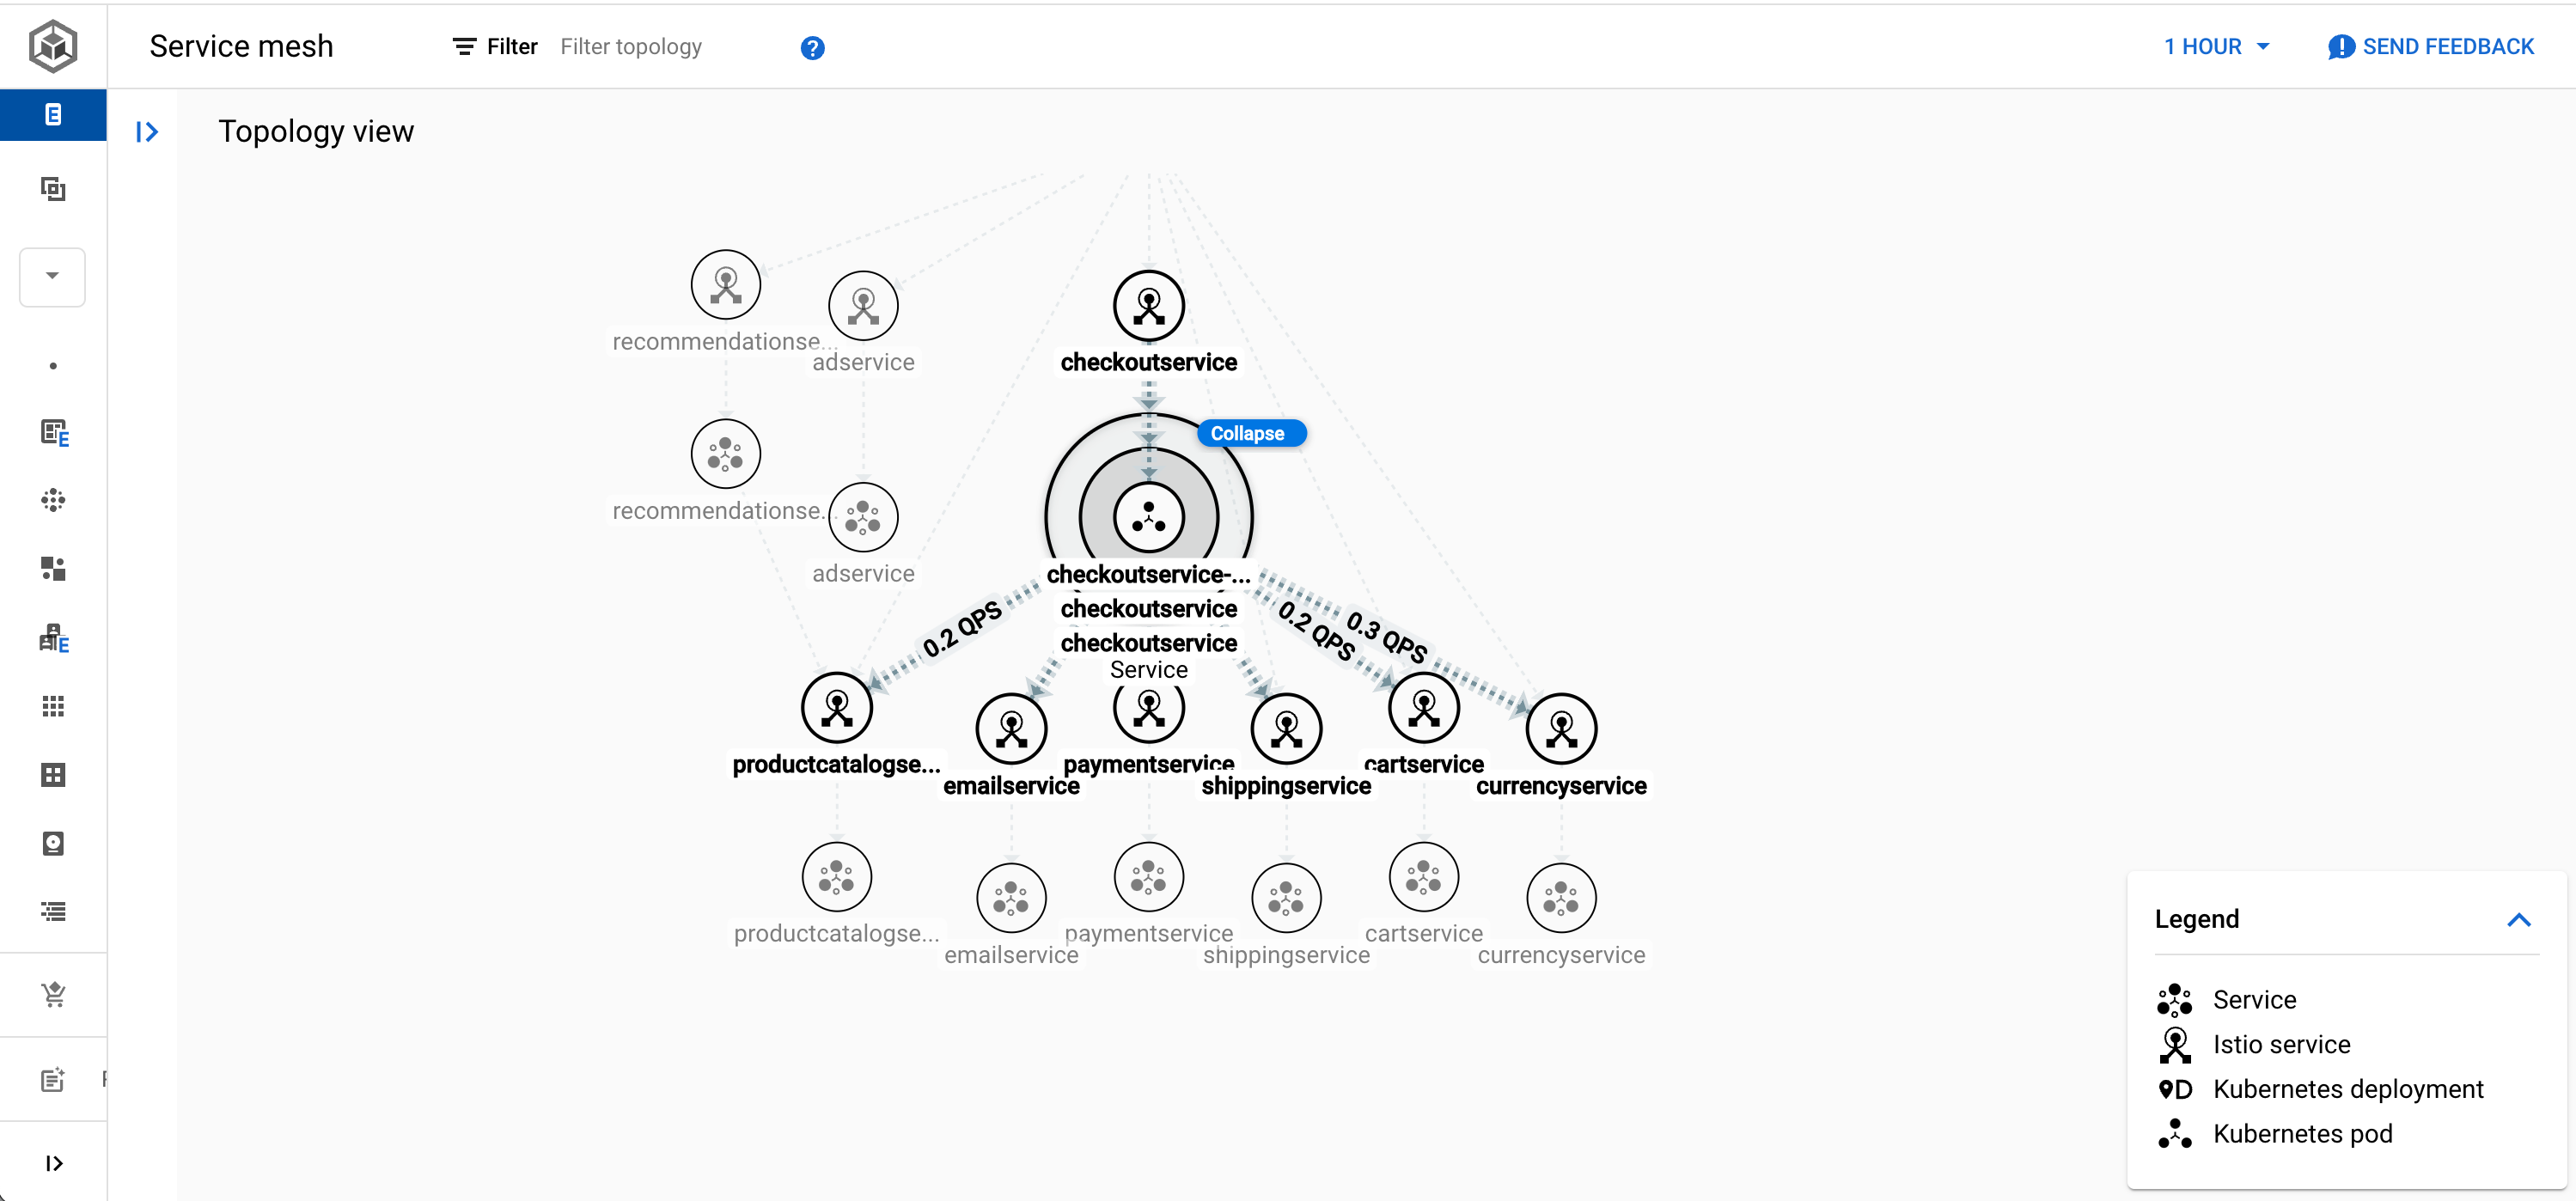
The dashboard also provides a graphical topology view, breaking down how each microservice is connected through its Pods, service and Istio service, as shown below. Part of the magic of the Service Mesh is that we don’t need to tell Istio how all of our microservices are connected together. The mesh topology is automatically generated by Istio simply observing network connections between services, thanks to the Envoy proxies.
Advanced Configuration
The Online Boutique example, while it does contain multiple microservices, is still quite a simple example of deploying a default mesh over existing services. However, using the new CRDs we have available from Istio we could add some advanced configuration that might prove useful. Let’s explore some more of Istio’s capabilities with some theoretical scenarios.
Advanced routing patterns
As we mentioned earlier, the VirtualService object can be used to implement some advanced routing patterns. A useful example of this is inspecting the user-agent HTTP header and routing the request accordingly. We can create conditional routes like this simply by adding a match to the http section of the object:
http:
  - match:
    - headers:
        user-agent:
          regex: ^(.*?;)?(iPhone)(;.*)?$
      route:
        destination:
          host: frontend-iphone
  - route:
    - destination:
        host: frontend
        port:
          number: 80
In this example, a regular expression finds user agents from iPhone users and directs their requests to a different service: frontend-iphone. Any other requests will continue to be handled by the frontend service. Any standard or custom HTTP header can be used.
Complex matching rules can be based on other parameters such URI and URI schemes, HTTP methods, ports and even query parameters. Once you have defined matching criteria for the different types of requests you want to capture, you specify a destination host. In the Online Boutique example, these are simple internal hostnames matching the Service objects that have been created. However, we can also provide more granular instructions for routing by combing VirtualServices with a DestinationRule.
Subsets and Destination Rules
The DestinationRule object applies logic to how a request should be routed once the VirtualService has determined where it should be routed. These objects let us configure advanced load balancing and traffic policy configurations, as well as implement patterns for canary and A/B testing.
A common pattern is to define the exact load balancing behaviour you require. For example, to apply the LEAST_REQUEST behaviour to requests for the frontend service, we could create the following object:
apiVersion: networking.istio.io/v1alpha3
kind: DestinationRule
metadata:
  name: frontend-destination
spec:
  host: frontend
  trafficPolicy:
    loadBalancer:
      simple: LEAST_REQUEST
With this object applied, endpoints handling the lowest current number of outstanding requests will be favoured by the load balancer. An alternative policy would be ROUND_ROBIN that will simple round-robin across all endpoints, although this is generally considered unsafe for many scenarios. These configurations can also be applied to a subset of endpoints, and in general, subsets can be used to implement traffic weighting and test patterns.
A common approach to testing changes with production traffic is the canary pattern, where a small subset of traffic is routed to a newer version of a workload to test for any issues. If the service is reliable, the new version of the workload can be promoted. Previously, this pattern could be achieved simply by creating Deployments that were sized to a particular ratio; for example, Deployment A containing 8 Pods and Deployment B containing 2 Pods, then using Deployment B for a canary workload. A Service routing traffic to all Pods would logically hit the canary workload 20% of the time.
However, this low-level approach is not scalable. With Istio CRDs we can define multiple routes in our VirtualService and simply assign a weighting to them. We do this by adding a subset to each destination, along with a weight. In our DestinationRule we then define these subsets, by adding additional label selectors that will match the appropriate Pods.
Here’s an example of an updated VirtualService definition for our frontend. We will now route 5% of all traffic to the canary version of the frontend:
apiVersion: networking.istio.io/v1alpha3
kind: VirtualService
metadata:
  name: frontend-ingress
  namespace: frontend
spec:
  hosts:
  - "*"
  gateways:
  - frontend-gateway
  http:
  - route:
    - destination:
        host: frontend
        subset: prod-frontend
      weight: 95
    - destination:
        host: frontend
        subset: canary-frontend
      weight: 5
We now need to create a matching DestinationRule, which defines additional configuration for the frontend host we’re referencing in our route. Inside the DestinationRule, we create the definitions for the subsets that are referenced in the VirtualService. Those subsets simply specify the extra label selectors that should be used.
apiVersion: networking.istio.io/v1alpha3
kind: DestinationRule
metadata:
  name: frontend-destination
spec:
  host: frontend
  trafficPolicy:
    loadBalancer:
      subsets:
      - name: prod-frontend
        labels:
          version: v1
      - name: canary-frontend
        labels:
          version: v2
Putting the objects together, we can see that 95% of the time requests will be routed to Pods that are part of the frontend service, but also have the label version:v1 in their metadata, while 5% of the time requests will be routed to Pods in that service with version:v2 instead.
Timeouts and Retries
Our new Service Mesh objects also provide some configuration options that can help with network resilience. For example, within the route section of our VirtualService object, we can specify a maximum timeout time to prevent a request hanging excessively waiting for a response. Returning a timeout error within a more appropriate timeframe can help us to spot errors more quickly, particularly when they are set up with appropriate SLOs and monitoring.
By default, failed requests will be retried by the Envoy proxy. Failures are sometimes due to transient network problems or simply an overloaded service, so with luck a retry may succeed. However, you may wish to tune this behaviour to enhance your overall application performance.
In this example, we add configuration to the route section of our VirtualService to specify that only 3 retries should be attempted, and that each retry should have an individual timeout of 3 seconds:
http:
  - route:
    - destination:
        host: frontend
        subset: prod-frontend
      retries:
        attempts: 3
        perTryTimeout: 3
        retryOn: connect-failure,409
Here we’re also using retryOn to tell the Envoy proxy specifically that retries should only be attempted if we received a connection timeout or the HTTP 409 Too Busy response.
Circuit Breaking
Circuit breaking is an interesting design pattern for distributed systems that is designed to prevent overloading or cascading failures across services. Much like a circuit breaker in your home will trip and stop electricity flowing to a faulty circuit, this pattern is designed to isolate a problematic system so that requests are no longer sent to it if we know for certain that the service has failed.
In Istio and Envoy, circuit breaking is achieved through the concept of “outlier detection”, in other words, detecting network behaviour that is abnormal. In a DestinationRule, we can define what an outlier behaviour would look like, which will trigger the ejection of Pods from a backend if that behaviour definition is met. Envoy continues to monitor ejected Pods and can automatically add them back into a load balancing pool if they return to normal behaviour.
Here’s an example:
apiVersion: networking.istio.io/v1alpha3
kind: DestinationRule
metadata:
  name: frontend-destination
spec:
  hosts: frontend
  subsets:
  - name: prod-frontend
  - labels:
      version: v1
    trafficPolicy:
      connectionPool:
        tcp:
          maxConnections: 100
      outlierDetection:
        consecutive5xxErrors: 3
        interval: 1s
        baseEjectionTime: 2m
        maxEjectionPercent: 50
In this configuration we have now limited the total number of concurrent connections to version 1 of our frontend to 100 by defining a connection pool within our traffic policy. Then we’ve created some parameters for outlier detection. If the service returns three consecutive HTTP 500 errors within a 1 second interval, the behaviour is considered abnormal, and the circuit breaker will trip. The Pod responsible for the behaviour will be ejected from the load balancing pool; this essentially means Istio will not consider it a candidate to receive requests, even though the Pod itself is not changed. We have specified that the base ejection should be 2 minutes, but the actual ejection time will be multiplied by the number of ejections, providing a kind of exponential backoff. Finally, we have also stated that we can only ever eject half of the Pods in this service.
Injecting faults
Fault injection is another interesting tool used to help test the resilience of a microservice architecture stack. If you’ve never done this before, you may think it’s odd to deliberately make services fail some of the time, but it’s better to know how your interdependent services will cope during a testing phase than to find out once everything has gone live! Historically, fault injection has required complex instrumentation software, but once again we can set this up using the all-powerful VirtualService object.
There are two different ways to simulate problems with the VirtualService object, which are defined in the fault subsection of the http section. The first is delay, which will create a delay before a request is forwarded from the preceding Envoy proxy, which can be useful for simulating things like network failures. The second option is abort, which will return error codes downstream, simulating a faulty service.
http:
  - route:
    - destination:
        host: frontend
        subset: frontend-production
    fault:
      delay:
        percentage:
          value: 2.0
        fixedDelay: 5s
      abort:
        percentage:
          value: 1.0
        httpStatus: 503
In the snippet above, we apply both techniques. A 5 second delay will be added to 2% of requests, while 1 in 100 requests will return an HTTP 503 error. We could apply this sort of configuration to a staging environment to test how well our other microservices deal with such faults. For example, you might be able to determine how well frontend services cope if some backend services fail or are degraded a percentage of the time.
Mirroring traffic
A final outstanding feature of Istio is the ability to create a complete mirror of all service traffic, for the purposes of capture and analysis. In the VirtualService object, the mirror section can define a secondary service which will be sent a complete copy of all traffic. This allows you to perform traffic analysis on traffic without interrupting any live traffic, and your mirror service will never interact with the original requestor.
http:
  - route:
    - destination:
        host: frontend
        subset: frontend-production
    mirror:
      host: perf-capture
    mirrorPercent: 100
In the above snippet, a copy of 100% of production traffic is also sent to a service called perf-capture. This could typically be an instance of a network or performance analysis tool such as Zipkin or Jaegar. Alternatively, traffic mirroring can also be used for testing and canary deployments. This way you can send real traffic to a canary service, without ever exposing it to your end-users.
Summary
In this post I’ve attempted to demystify the complex world of Service Mesh. As you’ll now appreciate, Istio and its CRDs add a whole new level of complexity to the control plane of our clusters, however they also provide us with some incredible new powers and abilities in terms of service management and observability. We’ve learned how to define the logic of application and network load balancing through Service Mesh, how to route requests to backend services and subsets of those services, and how to set up advanced routing and load balancing configurations. We’ve also looked at some features that would be extremely difficult to obtain without a Service Mesh, such as circuit breaking and traffic mirroring.
You might now be considering whether Service Mesh is right for your application, your cluster or even your fleet. But don’t decide just yet! In this post we’ve just laid down the foundations of Service Mesh. Over the next couple of posts I’ve got planned I’ll continue to explore its capabilities, first in multi-cluster scenarios, and finally in how it can help us with microservice application security. Then you’ll either be ready to fully embrace the mesh for all your projects, or never switch it on again!
